Dashboard Panels
mSupply Dashboard Panels
Panels🔗
There are several different Panel types or visualizations you can have on your dashboard.
For instructions on how to configure each type of Panel click here:
- Grafana Graphs
- Grafa Singlestats
- Grafana Tables
- Grafana Lists
- Grafana Text
- mSupply Region Map
- mSupply Table
- mSupply World Map
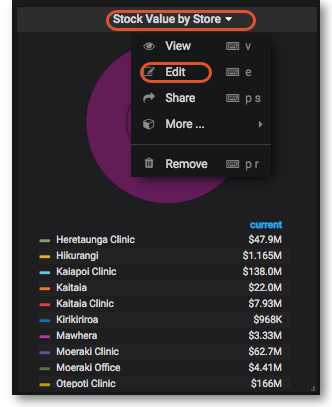
Clicking the title for a panel exposes a menu. The Edit option opens additional configuration options for the panel.

Time range controls🔗
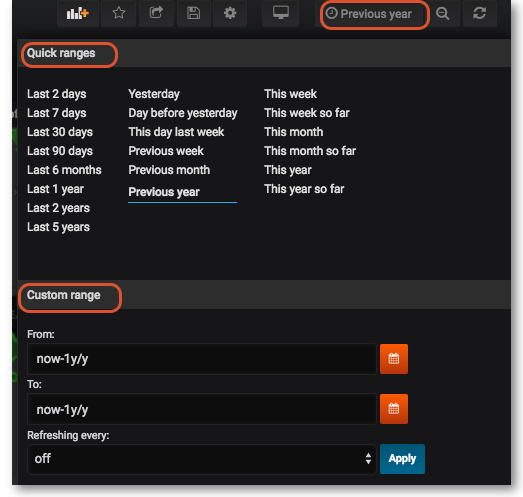
The Time Range controls the data you can see at the Dashboard-level and at the Panel-level.
To view or change the Time Range, in the top right click on the Dashboard time picker (looks like a clock face). This shows the current dashboard time and refresh interval. It also acts as the menu button to toggle the time range controls.

Click here for more details on Grafana time range controls
Sharing🔗
You can share both dashboards and panels with other users, as well as producing snapshots for external partners to view.
Sharing Dashboards🔗
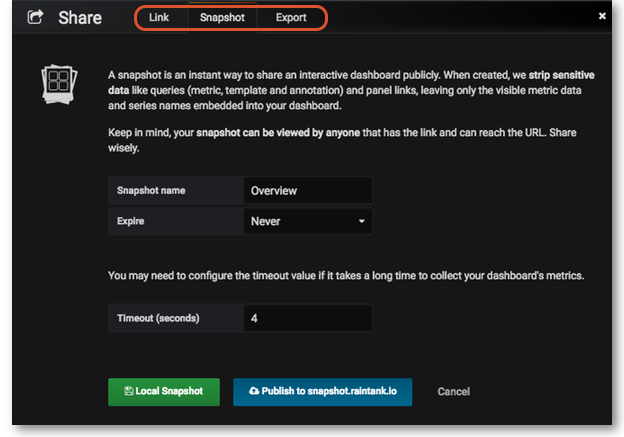
Click on the Share dashboard button in the top right navigation panel > Select one of three options: Link, Snapshot or Export.

For detailed instructions on each option click on Grafana Sharing Dashboards

Sharing Panels🔗
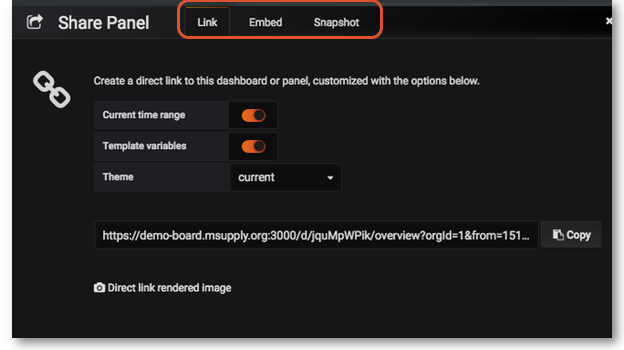
Click on the Title of the panel > from the menu select Share > Select one of the three options: Link, Embed or Snapshot. For detailed instructions on each option click on Grafana Sharing Panels
