Using mSupply Cold Chain
Sensors🔗
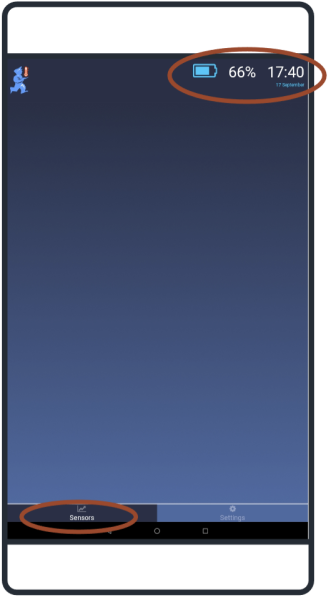
Sensors is the home screen for the mSupply Cold Chain application. You can also access the Sensors screen by pressing the Sensors tab on the bottom left of the screen.
The status bar displayed across the top of the home screen shows:
- Date and time: the current date and time are displayed as per the tablet time-zone settings.
- Battery: an icon and percentage are displayed indicating charge remaining for the tablet.
Sensor graphs🔗
When using the mSupply Cold Chain application for the first time, no sensors will be displayed. Please see Sensor Settings for the instructions on how to find and set up sensors. Once sensors are linked to the application, a graph displaying temperature logs will be displayed on the Sensors tab (home page).
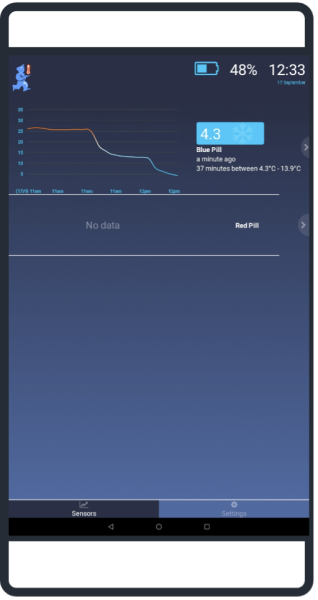
When a sensor is first linked and no temperatures have been logged, the graph will display with no data (as above for Red Pill). The graph will update when there are two temperature logs.
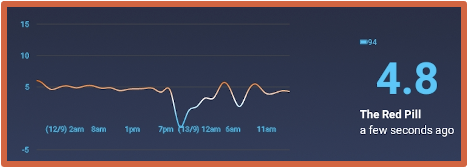
The graph will:
- Display a temperature log for up to 72 hours. The graph will display 30 logs. For less than 30 logs, each log will be displayed on the graph. For more than 30 logs, the overall time period will be divided into 30 periods and the average temperature for that period will be displayed.
- Display up to 6 time intervals on the x-axis. The time format is hh:mm. Date changes will always be indicated at 00:00 as dd/mm.
- Display the temperature range in degrees Celsius on the y-axis. The graph range will automatically update the minimum and maximum temperatures points to ensure that all logs can be displayed.
On the right-hand side, the following information will be displayed for each sensor:
- A battery icon and percentage indicating remaining charge for the sensor
- The current temperature
- The name of the sensor
- The time of the last temperature log
Breaches🔗
An indicator will also be displayed next to the text when there has been a breach for the sensor. Single exposure breach
A breach will be displayed when the temperature is lower or higher than the single exposure temperatures for the duration specified in the single exposure breach settings.
![]() For temperatures below the cold breach, the snowflake icon will flash.
For temperatures below the cold breach, the snowflake icon will flash.
![]() For temperatures above the hot breach, the thermostat icon will flash.
For temperatures above the hot breach, the thermostat icon will flash.
If there has been both a cold and a hot breach, the snowflake and thermostat icons will flash alternatively.
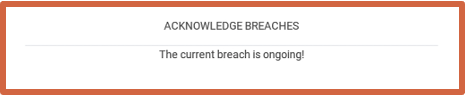
Single exposure breaches can be acknowledged and removed from the Sensor tab. Press and hold the alert to open the acknowledgment window. This will list all unacknowledged, single exposure breaches for your review. Selecting Acknowledge will remove the alert.
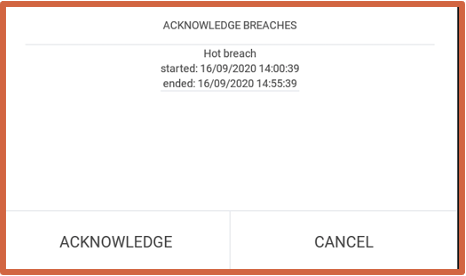
- Acknowledging breaches only removes the alert from the Sensor tab. Temperature logs remain and can be viewed in the Sensor Detail window and Export Data File (see below).
- Any subsequent single exposure breaches will still result in alerts on the Sensor tab.
- You cannot acknowledge alerts if the temperature is currently outside the specified range (“in breach”).
Cumulative exposure breach🔗
When the temperature is lower or higher than the cumulative breach temperatures for longer than the duration specified in the cumulative exposure breach settings over the last 72 hours. Text indicator giving the total time outside of specified temperature range as well as the range of temperatures.
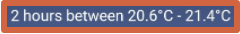
If there has been a hot and cold cumulative breach, there will be two text indicators.

Low battery warning🔗
When the sensor battery is 15 percent or below, the battery icon will flash.
Sensor detail🔗
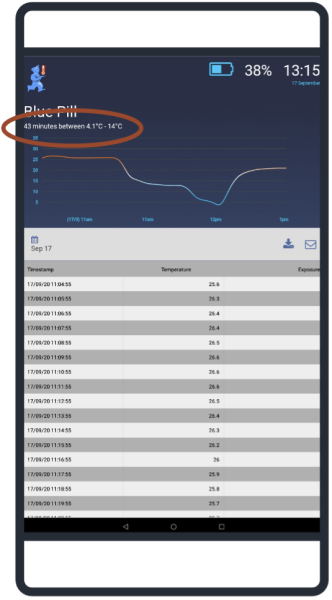
From the Sensors tab, you can tap anywhere on a sensor row to move to the Sensor Detail window. This window provides a graph and table of the temperature logs for the selected sensor. The table includes columns for:
- Timestamp
- Temperature
- Exposure (with hot and cold icon for breaches)
Selecting time period🔗
The graph and table displayed on the Sensor Detail screen can be filtered by date. Tapping on the date button will open a date selection window. Dates with no data (prior to logging start on in the future) will be greyed out and cannot be selected.

- To select a single date, double-tap on the required day and press OK.
- To select a date range, tap on the first day and then tap the second day to highlight the range, and press OK.
The new date range will be displayed on the Sensor Detail screen.
The new date range will also be used as the time period to calculate cumulative temperature breaches. If there has been a cumulative temperature breach during this period (using the temperature and duration settings in the cumulative exposure breach settings, the cumulative breach indicator/text will be displayed underneath the sensor name.
Export data file🔗
Pressing the export button from the Sensor Detail screen will result in all of the temperature logs displayed being exported as a comma-separated-value (csv) file.
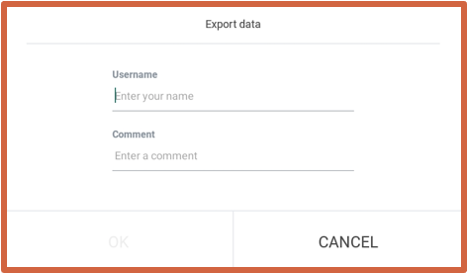
- You must type in your username (required).
- You may add a comment (optional) – this is a free-text field where you can add information such as job description, reason for export, etc.
The file will be exported and saved within a folder called CCE within the tablet's download folder. The csv file can be opened using any application that is csv enabled (including Microsoft Excel) and also shared (via USBs, CDs, emails, etc) as required.
The csv file created for export and email will only include data within the date range indicator on the sensor detail screen at the time of export.
Data files🔗
The data files created for export or email are identical in content and format.
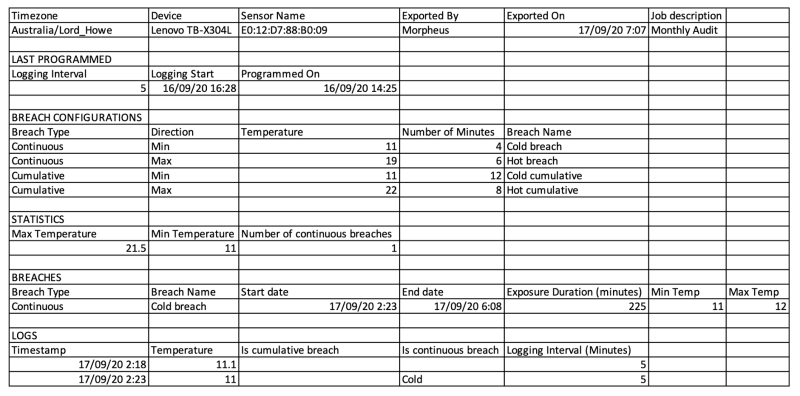
The header on the csv file has the following information: General
- Timezone – as set for the tablet
- Device – tablet name from which the file was exported
- Sensor name – descriptor for the sensor (or MAC address if the sensor is unnamed)
- Exported by – name of the person exporting/emailing the data
- Comment – any notes entered by the user in the export or email window
Last Programmed
- Logging interval – number of minutes between logs
- Logging start – begin date and time for the logs on this sensor
- Programmed on – date that the above settings were last changed for the sensor
Breach Configurations
- Breach type – Continuous (Single Exposure) or Cumulative
- Direction – Min (for temperatures below range) or Max (for temperatures above range)
- Temperature – temperature limit set for the breach
- Number of minutes – duration set for the breach
- Breach name – descriptor given to each breach
Statistics
- Max temperature – highest temperature recorded by the sensor
- Min temperature – lowest temperature recorded by the sensor
- Number of continuous breaches – number of single exposure breaches (either hot or cold)
Breaches
- Breach type – can be either continuous (single exposure) or cumulative
- Breach name – descriptor for the breach
- Start of breach – date and time
- End of breach – date and time
- Exposure duration – length of breach in minutes
- Min temperature – lowest value during the breach
- Max temperature – highest value during the breach
Logs
- Timestamp – date and time
- Temperature – recorded temperature in degrees Celsius
- Is cumulative breach – if yes, column will display either hot or cold depending on direction of breach
- Is continuous breach – if yes, column will display either hot or cold depending on direction of breach
- Logging interval – the interval between temperature logs in minutes
Returning to the Sensors screen🔗
From the Sensor Detail screen, there are two options to return to the Sensors screen:
- Swipe right
- Use the tablet back navigation button