Monitoring
The Monitoring section displays cold chain temperature monitoring data in three different ways:
- A chart view which visually displays temperature data from all sensors
- A list view of all recorded breaches
- A list view of all temperature logs
Viewing Monitoring data
Choose Cold chain > Monitoring in the navigation panel.
This page contains three tabs, displaying different views of temperature monitoring data. The tab which will be displayed by default is the Chart tab.
Chart
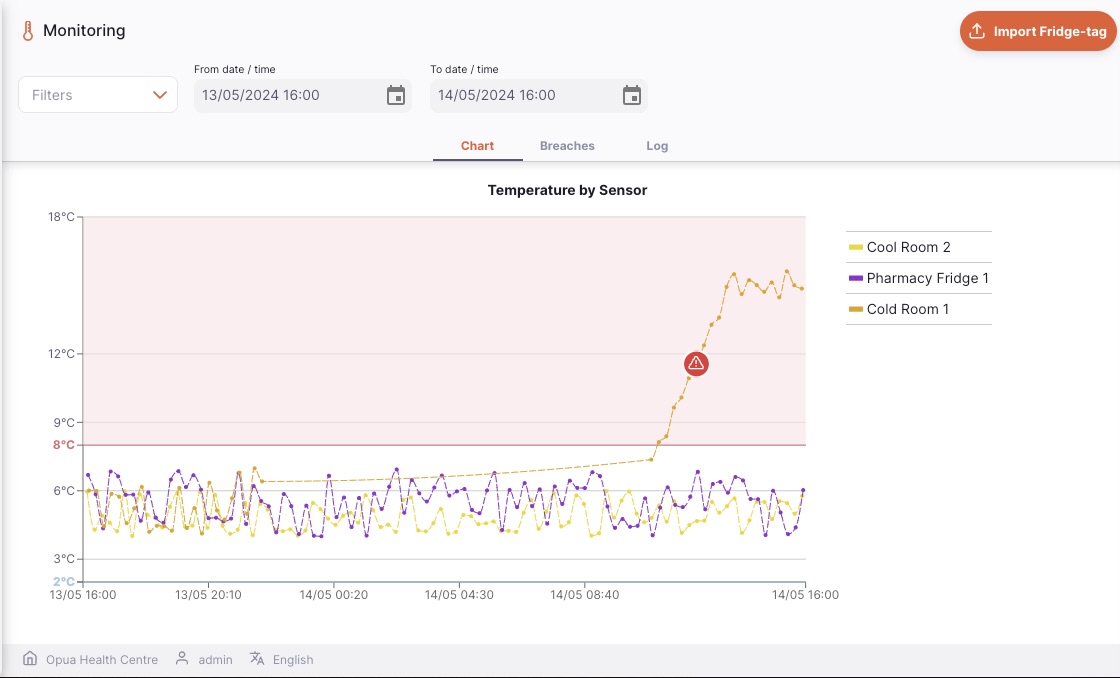
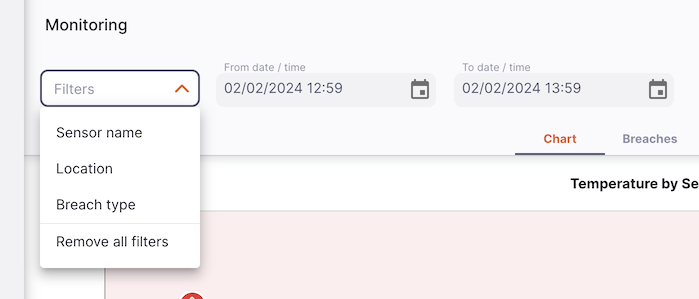
The chart tab displays a chart plot for all configured sensors. You can filter the data displayed by:
- Sensor name
- Location
- Date/Time Range
- Breach type
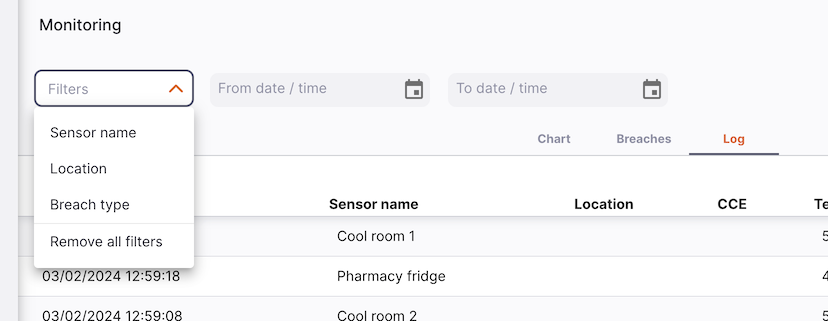
To add a filter to the page, choose the required filter from the drop down.
From date/time and To date/time fields to look at a longer period of time.
The filters also retain their values when you switch between the tabs.
The date time filter will apply to all of the tabs in the monitoring section.
If the sensor has recorded a breach - an icon will be shown on the chart. Clicking on the icon displays information about the breach, with a button which takes you to the list of all breaches:
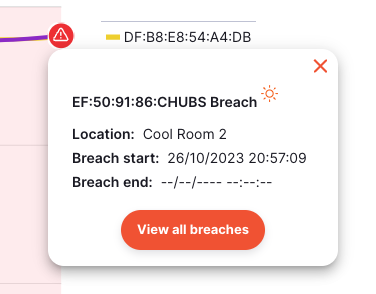
To close the popup, click the red x in the top right corner.
Also shown on the chart are red (top) and blue (bottom) shaded areas. These show the standard temperature breach threshold values of 8°C and 2°C.
If you select a long time period, you may see a warning message like this:
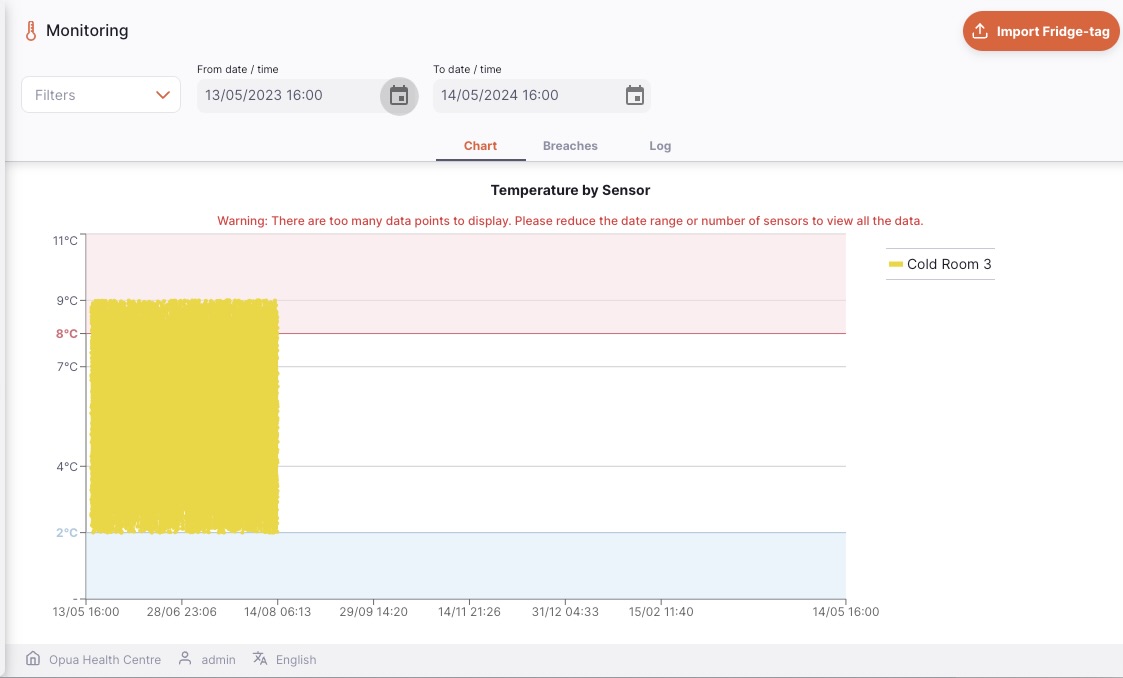 To avoid this, you may need to select a shorter time period or filter the data to show only the sensors you are interested in.
Only the first 8640 data points are shown on the chart.
To avoid this, you may need to select a shorter time period or filter the data to show only the sensors you are interested in.
Only the first 8640 data points are shown on the chart.
Breaches
The Breaches tab displays a list of all recorded breaches.
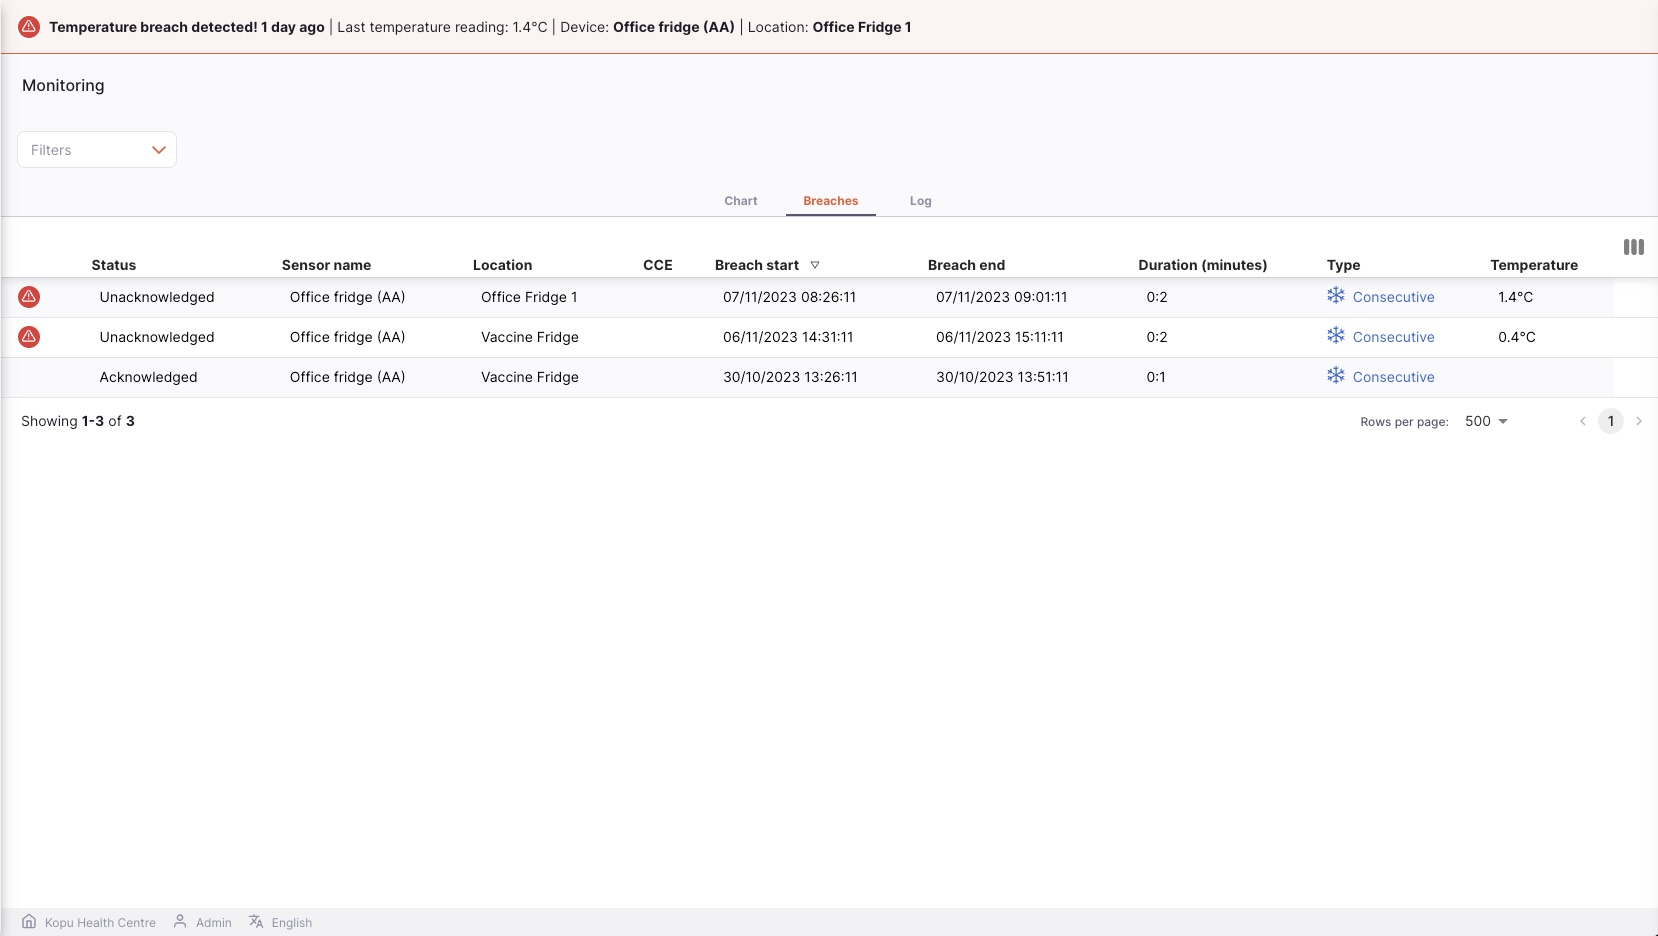
The list of breaches is divided into 10 columns:
| Column | Description |
|---|---|
| An icon showing an alert if this breach is unacknowledged | |
| Status | The breach status can be Acknowledged or Unacknowledged |
| Sensor name | Name of the Sensor |
| Location | Current location linked to the sensor |
| CCE | Name of the cold chain equipment item which the sensor is associated with |
| Breach start | Date and time at which the breach started |
| Breach end | Date and time at which the breach ended, if applicable |
| Duration | The duration of the breach, if it has ended. If the breach has not ended then Ongoing is shown |
| Type | The type of the breach: this is a combination of Hot or Cold (shown by the icon and text colour) and Consecutive or Cumulative |
| Max / Min | The temperature recorded when the breach was updated, which is the start or end of the breach (if the breach has ended) |
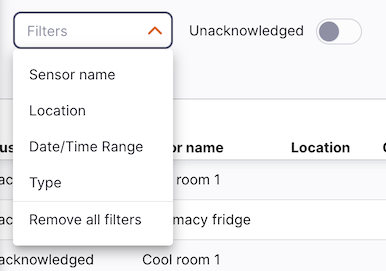
You can filter the data displayed by:
- Sensor name
- Location
- Date/Time Range
- Type
- Unacknowledged
To add a filter to the page, choose the required filter from the drop down. To remove any applied filters, click the Remove all filters option.
Berlinger Fridge-tags and breach events
Acknowledging breaches
From this list, you can choose to acknowledge a breach which then will stop the breach showing as a notification at the top of the page. If a breach has been unacknowledged you will see a red alert icon on the left of the row, like this:
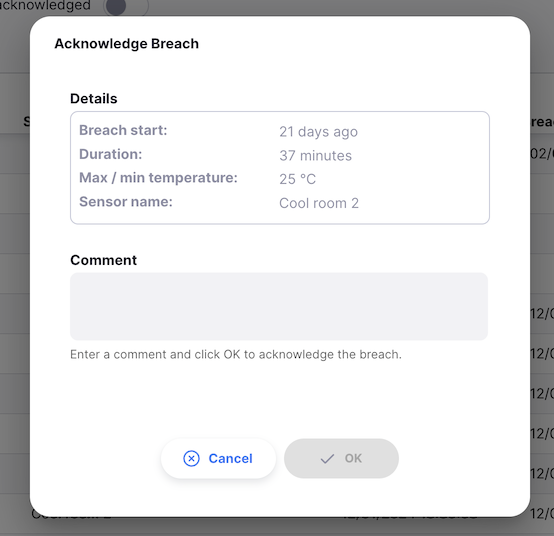
Clicking the icon will show a window, in this you can enter a comment to acknowledge the breach:
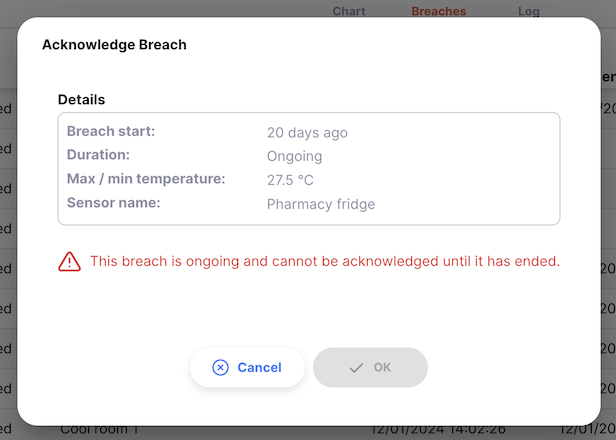
If a breach is ongoing, i.e. it has not ended yet, then you are unable to acknowledge it yet, and the window is disabled:
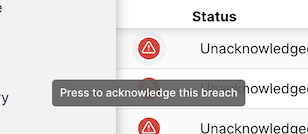
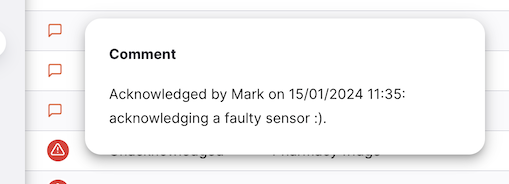
Once a breach is acknowledged, the red alert icon is no longer shown for that breach row. Instead, a speech bubble icon is shown. Hovering over this (on the desktop / web version) or pressing it for a second (on tablets) will show the comment:
Log
The Log tab shows a list of all temperature logs.
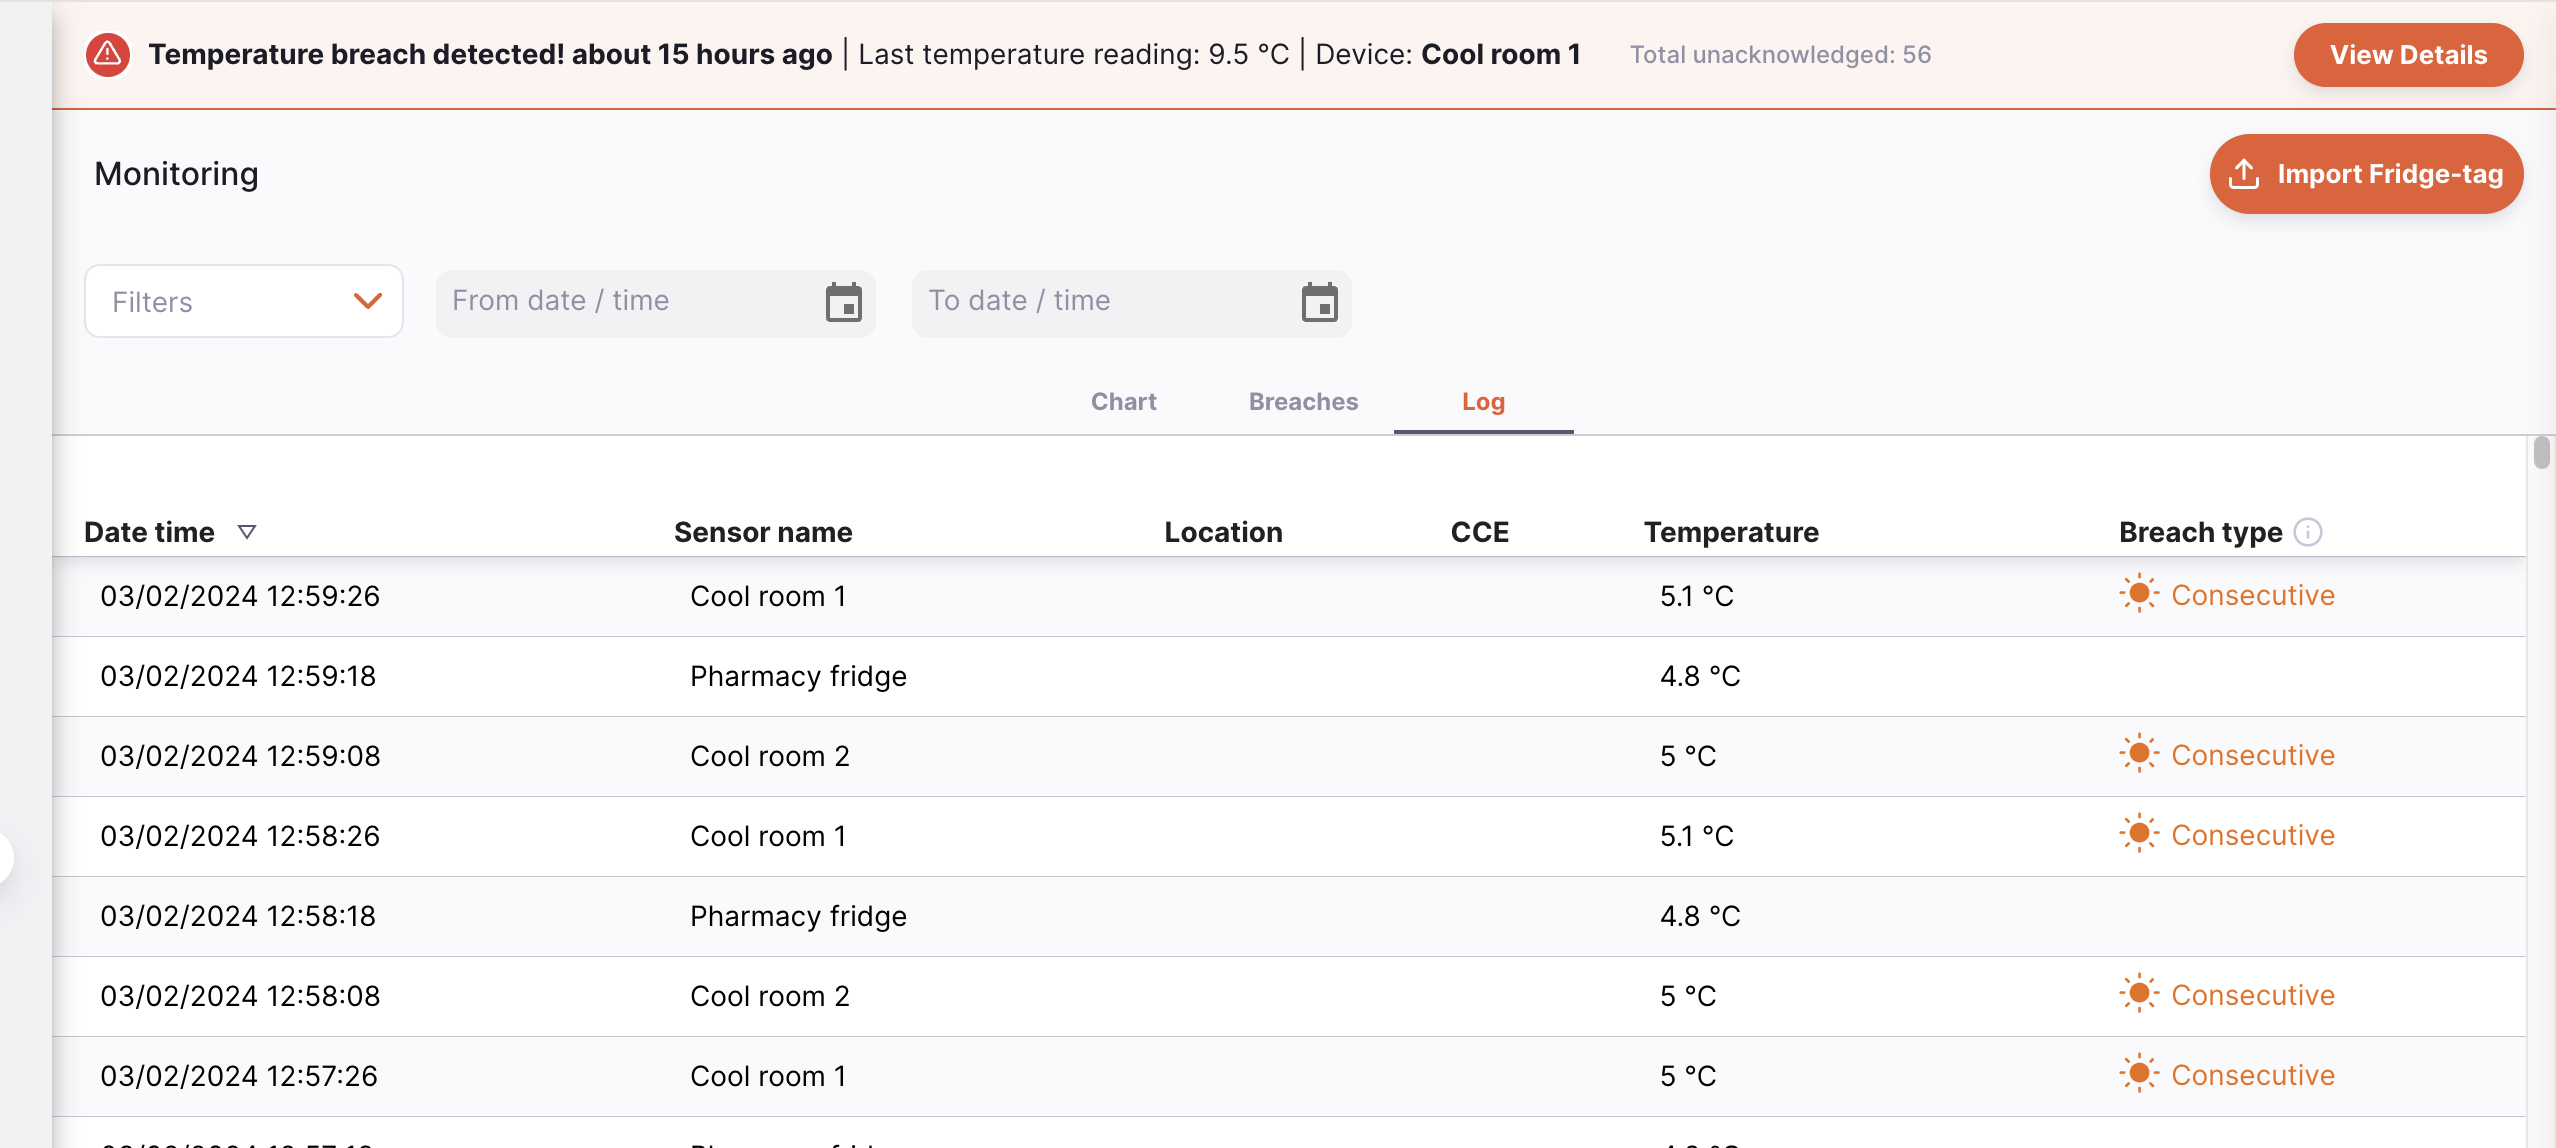
The list of temperature logs is divided into 6 columns:
| Column | Description |
|---|---|
| Date time | Date and time of the most recent activity for this sensor |
| Sensor name | Name of the Sensor |
| Location | Current location linked to the sensor |
| CCE | Name of the cold chain equipment item which the sensor is associated with |
| Temperature | The most recent temperature reported by the sensor |
| Breach type | If the sensor has had a breach, this shows the type of the most recent breach. This is a combination of Hot or Cold (shown by the icon and text colour) and Consecutive or Cumulative. |
You can filter the data displayed by:
- Sensor name
- Location
- Date/Time Range
- Breach type
To add a filter to the page, choose the required filter from the drop down.
-
The list can display a fixed number of logs per page. On the bottom left corner, you can see how many logs are currently displayed on your screen.
-
If you have more logs than the current limit, you can navigate to the other pages by tapping on the page number or using the right of left arrows (bottom right corner).
-
You can also select a different number of rows to show per page using the option at the bottom right of the page.
Importing Fridge-tags
If you are using Berlinger Fridge-tags, you can import the data directly into Open mSupply. To do this, insert the USB of the Fridge-tag into your computer.
Then click the Import Fridge-tag button:
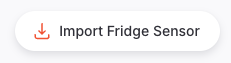
This will open a file browsing window, allowing you to select the .txt file of the Fridge-tag data. Simply click on the file and wait for the import to complete.
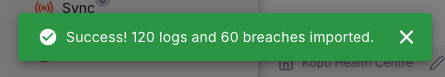
If the process was successful you will see a notification in the bottom left of the screen:
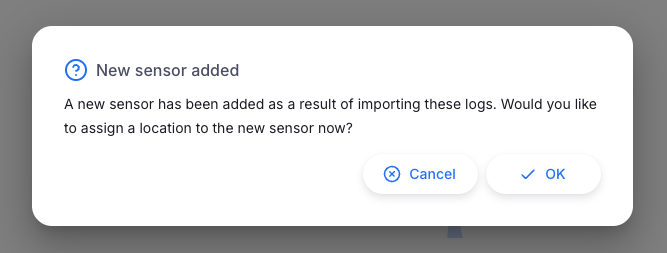
and if there was a new sensor added, you'll be prompted to add the sensor details:
The following Berlinger devices are compatible with Open mSupply:
| Device | Breach data displayed | Temperature graph plotted |
|---|---|---|
| Q-tag CLm doc | Yes | Yes |
| Q-tag CLm doc D | Yes | Yes |
| Q-tag CLm doc Ice | Yes | Yes |
| Q-tag CLm doc Ice R | Yes | Yes |
| Q-tag CLm doc L | Yes | Yes |
| Q-tag CLm doc LR | Yes | Yes |
| Fridge-tag 2 | Yes | No* |
| Fridge-tag 2E | Yes | No* |
| Fridge-tag 2L | Yes | Yes |
| Fridge-tag UL | Yes | Yes |
*Logger device does not capture individual temperature logs